
Review analytics for your sent editions and see how your editions perform over time
.png?width=688&height=172&name=Untitled%20design%20(18).png)
Use Axios HQ’s analytics to help understand the performance of your series editions. Our metrics can help gauge the effectiveness of your content and engagement with your audience.
Table of Contents:
- Viewing edition analytics
- Downloading edition analytics
- Edition statistic definitions
- Analytics over time
- Anonymized analytics
- FAQs
1. Viewing edition analytics

🛠️ How it works:
- From your Workspace, navigate to the Sent page by selecting "Sent" from the Status toggle.
- You’ll see the title, sent date, as well as various analytics for each send. Hover over your statistics to see the descriptions
- Click on “View Report” to view additional edition-level analytics.
- Within this view, there are six tabs:
- View edition - Where you can see a copy of the edition that was sent out.
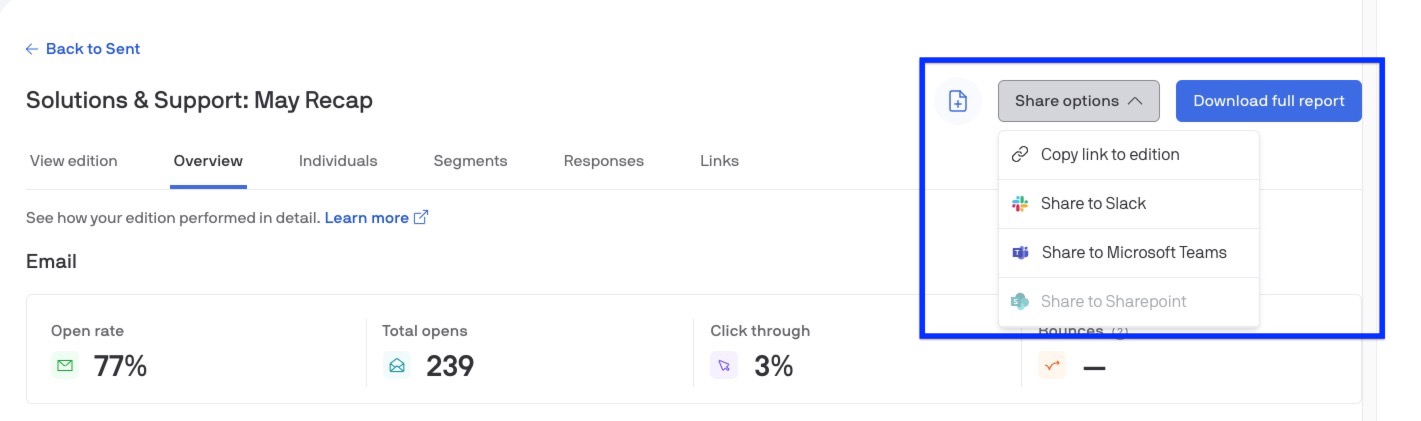
- Overview - Hosts the majority of your email statistics — open rate, total opens, click through rate, bounces. You can also see open rates over time, web views, and the source of how readers found your edition (Original email, Slack, Web, Teams, and Resend email).
- Individuals - View opens, clicks, web views, and delivery status for each recipient.
- Segments - View recipient count, open rate, click through, bounces, and web views for all segments.
- Responses - View edition reactions, feedback, and poll responses
- Links - View all links in the edition, total clicks, unique clicks, and who specifically clicked the link.
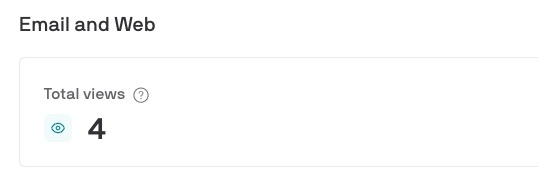
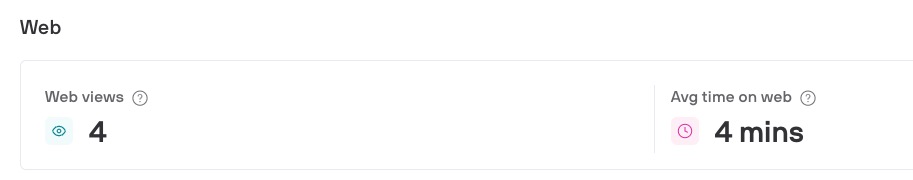
- Web analytics in the "View Report" view look slightly different depending on private link access:
- Anyone with the link: Shows total views which are email and web views combined.
- Recipients only & Recipients and current audience: Shows web views and average time on web.
- Anyone with the link: Shows total views which are email and web views combined.
2. Downloading edition analytics

🛠️ How it works:
- From the “View Report” view, select the “Download full report” button in the top right corner to download the analytics as a CSV file.
- The CSV file will have the recipients' name, email, segments, first open time stamp, number of opens, clicks, web analytics, status, source, and date added.
- You can use the analytics report to update your audience list.
- For example, if you would like to remove all failed recipients, simply filter the ‘Status’ column and delete all rows with failed deliveries. Then remove all columns except Name, Email, and Segments and save the updated CSV to upload it to your audience list. Learn more here.
📈 Pro-tip: From the edition-level analytics view, you can also save the edition as a template, share the edition to Slack, Teams, Sharepoint, or copy the link.
3. Edition Statistic Definitions
- Avg time on web: Average of the longest time that users spent reading the edition on the web.
- Bounces: Total number of bounces – these may have been resolved into deliveries and not appear in the individuals tab.
- Click through: The percentage of recipients who clicked any link in your email.
- Email clicks: The number of times a recipient clicked a link in the edition.
- Open rate: The percentage of recipients who opened your edition.
- Sources: How readers found your edition.
- Thumbs up: The total number of positive responses to your newsletter edition. If your count reads “N/A” email reactions are not turned on, you do not have any reactions to your newsletter edition, or the analytics are still calculating.
- Total email opens: The total number of times this edition was viewed as an email.
- Total opens over time: The times the edition was opened.
- Web views: The total number of times the edition was viewed on the web.
- Word count: The number of words in your newsletter edition.
4. Analytics over time
In addition to looking at the analytics for each edition of your series, you can also compare the performance of your series over time.

🛠️ How it works:
- Navigate to your series analytics, by clicking the "Analytics" button in the top right corner.
- Choose between looking at the full history of your series, the last 10 sends, or set a custom range.
- You’ll see statistics for whichever time frame you select:
- Total sends – the number of editions sent
- Total deliveries – the total number of emails delivered across these editions
- Average open rate – the average open rate across editions
- Average click rate – the average clickthrough rate across edition
- Average word count – the average word account across editions
Additionally, there are two line charts that illustrate your series open and click through rates over time.
- These charts allow you to compare the performance of your series against the internet average, derived from statistics released by other newsletter services, and your own benchmark.
- By default, this benchmark is the cohort average of other HQ senders with the same audience type (internal vs. external) and size, or you can set your own custom average if you want to compare against your average with a previous sending service or have a goal you’d like to reach!

- To edit your benchmark, select the pen and paper icon next to “Your benchmark.”
You can also see your top-performing editions and links. Looking at commonalities across your top-performing editions may give you insights into what works best and help you write more effective editions.
- Use the “Download PDF” button in the top right corner to download the analytics page as a PDF.
5. Anonymized Analytics
We offer the option to turn on anonymized analytics for your entire organization to hide individual and segment level analytics. If you are interested in turning this feature on for your organization, email help@axioshq.com or notify your Account Manager.
Some things to note:
- You will not be able to download an analytics report.
- Individual and segment level data is hidden
- This feature is implemented organization wide and it cannot be turned on for specific series.
- You will still be able to see the number of opens, open rate, click through rate, bounces, and links clicked.
- Anonymized analytics will also be applied to one-off sends and your analytics page.
6. FAQs
Why are my open rates so low? A recipient said they read the newsletter, but analytics are showing that they never opened it.
We determine our opens via pixel-tracking, which means that if a recipient does not load images when they open their email, their open will not be tracked. We suggest asking your audience to turn on image viewing.
Go deeper: The process to turn on automatic image loading varies by email client. Here are instructions for Gmail and Outlook.
Why are my open rates so high / seem skewed?
There are a few factors that can influence open rates:
- If someone’s inbox automatically displays the selected email in a sidebar, they might be counted as opening a newsletter every time they click on that email while shuffling through their inbox.
- Some email spam filters actually open emails and click links in them to test for security reasons. This can result in opens and clicks being attributed to recipients even if they did not interact with the email, and can sometimes lead to higher open rates.
Why does a single recipient show so many opens?
- Sometimes, people open and close emails without realizing as they navigate through their inbox.
- If a newsletter is forwarded to other recipients, their opens and clicks will be attributed to the original recipient. This will not influence your open or clickthrough rates, but can increase the total click number and explains a recipient having many opens linked to them.
- Spam filters that open emails to test their safety can also increase the number of opens attributed to a single recipient.
How to turn on reactions?
Navigate to your Series settings by clicking the gear icon in the top right, then click on the Design section and scroll to the Feedback section. Toggle “Feedback” on and off, change your feedback text and decide if you want to collect emails for each response.

I have 5 bounces but no failed deliveries. What does this mean?
Emails attempt delivery multiple times before failing. An email could bounce a couple of times and then eventually get delivered.
How is the open rate calculated?
Open rate tells you the percentage of individual recipients who opened your newsletter.
- This is tracked via a hidden pixel in the email.
- Some email clients do not automatically download images. If a recipient opens the email but does not elect to download the images, they will not be tracked as having opened the email.
- If your organization has this setting, it is important to let your audience know that they need to download images, or talk to your IT team about adjusting those settings for Axios HQ emails.
We have anonymized analytics, what will we be able to see on each edition-level analytics tab?
You will be able to view the Overview, Responses, and Links tabs, but will not see the Individuals or Segments tabs.
If we do not use the Resend feature, how will this impact our total opens over time and source data chart?
If the Resend feature is off, the Resent email option will appear as disabled on the source data donut chart. It will not appear in the total opens over time chart.
Can we see if someone viewed the edition from a Slack post?
You can see the number of people who viewed the edition from a Slack post in your edition-level analytics. Navigate to “Sent” > “View Report” > “Overview” and then scroll down to “Source.” You can see how many users but you cannot see the individual user information.
Can we see if someone viewed the edition from a Teams post?
You can see the number of people who viewed the edition from a Teams post in your edition-level analytics. Navigate to “Sent” > “View Report” > “Overview” and then scroll down to “Source.” You can see how many users but you cannot see the individual user information.
Can we see how many recipients opened the resend email?
Yes, you can see the number of recipients that opened the resend email but you will not be able to see the individual recipient’s information. Navigate to “Sent” > “View Report” > “Overview” and then scroll down to “Source” to view the amount of users that viewed the email from the resend. You can also see the impact of resends on the “Total opens over time” chart on the same page
Have any questions or feedback?
Feel free to reach out to your Account Manager or help@axioshq.com with any questions. You can also submit feedback directly to our Product team here.